ich habe versucht einen Drawdown Chart von der Netflix in R in einem Chart darzustellen.
Hier ist mein Code:
Code: Alles auswählen
library(tidyquant)
library(timetk)
library(ggplot2)
library(tibble)
library(dplyr)
library(corrplot)
library(tidyr)

netflix <- tq_get("NFLX",
                  from = '2009-01-01',
                  to = "2018-03-01",
                  get = "stock.prices")

netflix %>%
  ggplot(aes(x = date, y = adjusted)) +
  geom_line() +
  ggtitle("Netflix since 2009") +
  labs(x = "Date", "Price") +
  scale_x_date(date_breaks = "years", date_labels = "%Y") +
  labs(x = "Date", y = "Adjusted Price") +
  theme_bw()


  # add drawdown to each date
nfdd <- netflix %>% arrange(date) %>% mutate(drawdown=adjusted-lag(adjusted))

# calculate mean drawdown
meandd <- mean(nfdd$drawdown[nfdd$drawdown<=0], na.rm = TRUE)

# plot
nfdd %>%
        ggplot(aes(x = date, y = drawdown)) +
        geom_line(color="blue", alpha=0.7) +
        ggtitle("Netflix drawdown since 2009") +
        labs(x = "Date", "Drawdown") +
        scale_x_date(date_breaks = "years", date_labels = "%Y") +
        labs(x = "Date", y = "Drawdown") +
        scale_y_continuous(limits = c(-10, 0)) +
        geom_hline(yintercept=meandd, linetype="dashed", color="red", size=1)+
        theme_bw()
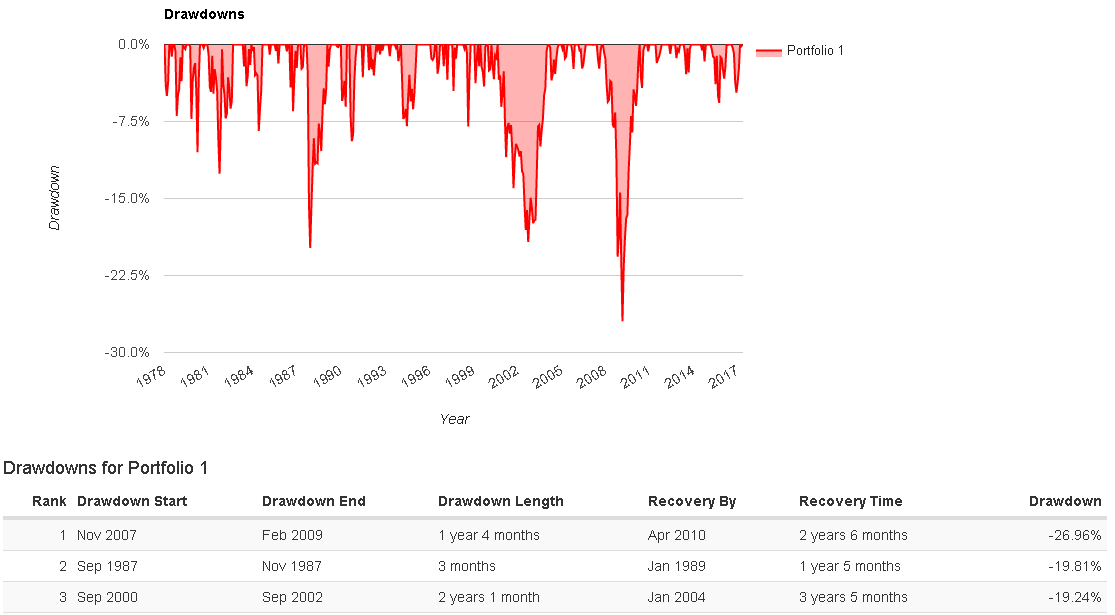
Ich möchte allerdings so eine verbundene Linie haben wie hier: https://static.seekingalpha.com/uploads ... 040_DD.png
Kann mir jemand helfen dies auszubessern?